3. CREATING THE SOFTWARE PLATFORM USING sDK
In the previous chapter we have designed the hardware component of our embedded system. To complete the design process we must now create a software component for our embedded system. This application specific software will be executed on the MicroBlaze microprocessor that is a part of our hardware platform.
When using Xilinx development tools, software design process is done using the Software Development Kit (SDK) tool. Our software application will be developed for the hardware platform built in IP Integrator tool.
Illustration 3.1 shows, in detail, SDK application development flow.

Illustration 3.1: SDK application development flow
The first step in software creation is to export the hardware design into the SDK. The hardware design will be exported to an XML files that will be used by the SDK to create a software application for our hardware.
To create a software platform for your embedded design, use the following steps:
- Select File → Export → Export Hardware option from the main Vivado IDE menu
- In the Export Hardware dialog box, make sure that Include bitstream check box is checked, and Export to field is set to <Local to Project>, see Illustration 3.2 and click OK
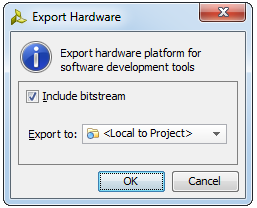
Illustration 3.2: Export hardware dialog box
- To launch SDK after the hardware platform has been exported, select File → Launch SDK from the main Vivado IDE menu
-
In the Launch SDK dialog box, make sure that both Exported location and Workspace are set to <Local to Project>, see Illustration 3.3 and click OK
SDK will be launched in a separate window, see Illustration 3.4
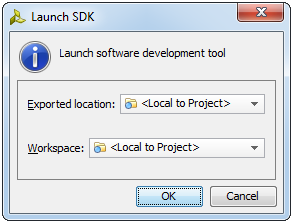
Illustration 3.3: Launch SDK dialog box

Illustration 3.4: SDK main window
As you can see from the illustration above SDK has automatically created a new hardware platform specification, modulator_wrapper_hw_platform_0 with the system.hdf file inside. The system.hdf file is the hardware platform specification file which contains information about the target device, address map for the selected processor, about the IP blocks present in the design along with the links to the datasheets of all system peripherals.
- The Source tab shows the content of the system.hdf file
- The Overview tab shows most of the information necessary for writing software
3.1 Board Support Package
Each software project must have a corresponding Board Support Package (BSP).
A Board Support Package is a collection of libraries and drivers that form the lowest level of your software application stack. Before you can create and use software applications in SDK, you must create a board support package. You can create more then one application to run on the BSP.
You can use SDK to create BSP for two different run-time environments:
- Standalone – A simple, low-level software layer. It provides access to basic processor feature such as cache, interrupts and exceptions as well as the basic features of a hosted environment, such as standard input and output, profiling, abort and exit.
- Xilkernel – A simple and lightweight kernel that provides POSIX style services such as scheduling, threads, synchronization, message passing, and timers. The kernel requires a programmable timer that is either built-in or attached to the processor as a peripheral.
In SDK we can have a multiple Board Support Packages. For example, one for a design that runs on the standalone environment, and one that uses Xilkernel.
Generating BSP is very easy. The program that is launched is called LibGen (Library Generator). It reads the system.mss file for directions on which drivers and libraries to include. The MSS file is built when a software platform or BSP is created, and contains a software instance for every processor and peripheral IP.
The purpose of running LibGen is to compile the BSP ones. Ones compiled by LibGen, the BSP resides as an object ready to be linked to the compiled software application.
To create a Board Support Package do the following:
- Select File → New → Board Support Package option, see Illustration 3.5
- In the New Board Support Package Project dialog box leave all default options as they are set and click Finish, see Illustration 3.6
- In the Board Support Package Settings dialog box leave all default options as they are set in all four tabs (Overview, standalone, drivers and microblaze_0) and click OK, see Illustration 3.7
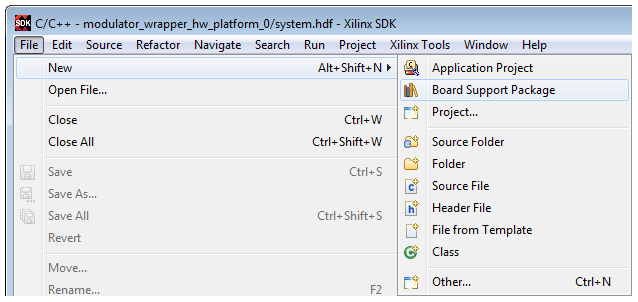
Illustration 3.5: Board Support Package option
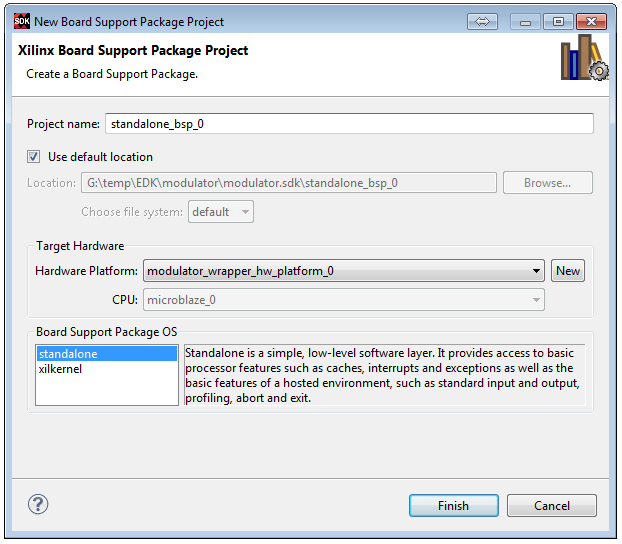
Illustration 3.6: New Board Support Package Project dialog box

Illustration 3.7: Board Support Package Settings dialog box
3.2 Creating an application project
Now is the moment when you will create an application project. The actual application will be written in C/C++ programming language. The SDK will create and maintain make file for you.
To create an application project, do the following:
- Select File → New → Application Project and the Application Project dialog box will appear, see Illustration 3.8
-
In the Project name field, type a name of the new project. In our case it will be modulator_no_intc, see Illustration 3.8
Note: In our design we will create two application projects. One will be without interrupt controller (modulator_no_intc), and the second one will be with interrupt controller (modulator_intc).
- Select the location for the project. If you want to leave default location as it is displayed in the Location field, leave the Use default location check box selected. Otherwise, type or browse a directory location of your new project.
- For the Target Hardware, leave modulator_wrapper_hw_platform_0 selected as the Hardware Platform and microblaze_0 as the Processor
- For the Target Software, choose C as the Language, standalone as the OS Platform, and choose Use existing standalone_bsp_0 as the Board Support Package
- Click Next
-
In the Templates dialog box, choose one of the available templates to generate a fully-functioning application project, see Illustration 3.10
SDK provides a useful sample applications, which are listed in the Available Templates box. Beside the Available Template box you can find a description box which gives a brief description of the selected sample application.
To create a blank C project, select Empty Application template, see Illustration 3.9
- Click Finish to create our modulator_no_intc application project
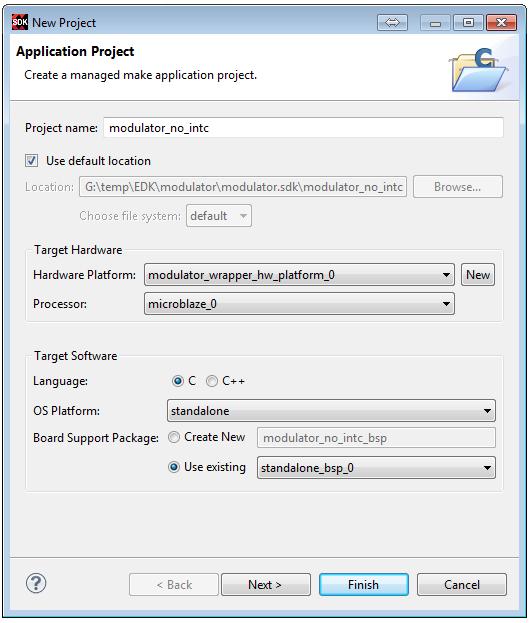
Illustration 3.8: Application Project dialog box
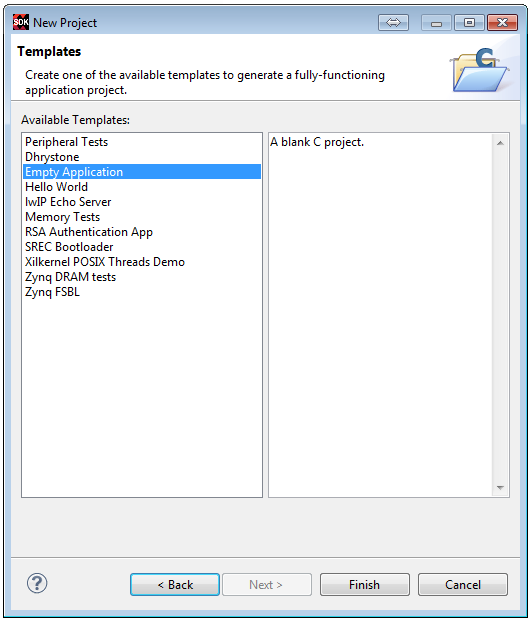
Illustration 3.9: Templates dialog box
After we have created Board Support Package project (standalone_bsp_0) and C Project (modulator_no_intc), both of them should appear in the SDK Project Explorer window, see Illustration 3.10
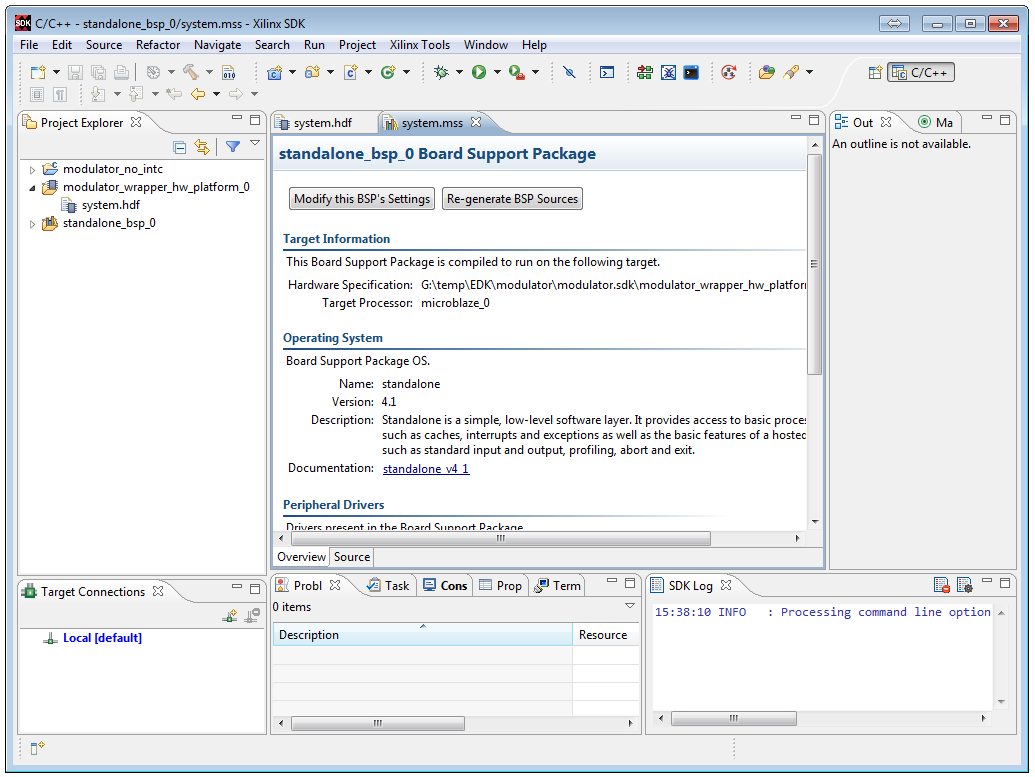
Illustration 3.10: SDK main window after C project creation
3.3 Creating a C/C++ source file
Now it's time to start writing the software for this project. With the Vivado tool we have advantage to develop software independently from the hardware, using SDK tool.
To create our modulator_no_intc.c source code, do the following:
- Expand modulator_no_intc project in Project Explorer and src folder should appear. In the src folder you should find your source code after creation.
- Right-click on the src folder and select New → Source File option
- In the New Source File dialog box
- check Source folder field,
- enter Source file name (in our case it will be modulator_no_intc.c),
- and use “Default C source template” as Template option, as it is shown on the Illustration 3.11
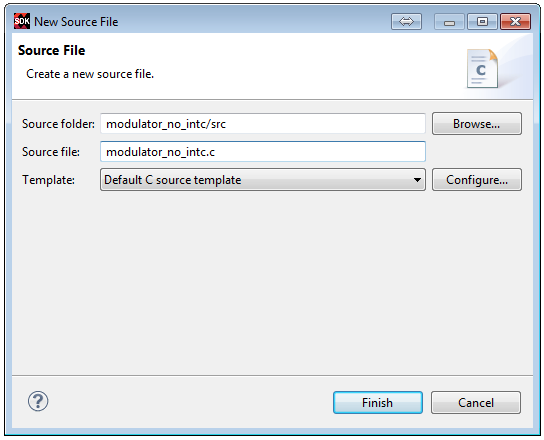
Illustration 3.11: New Source File dialog box
- Click Finish and your modulator_no_intc.c source file should appear in the src folder, as we said
- Double-click on the modulator_no_intc.c source file in the Project Explorer and it will be immediately opened
- Copy your source code in it, or write directly in it
- When you finished with all modifications, click Save and SDK will automatically build your application
As we already said in the previous sub-chapter, we will develop two application projects. One will be without interrupt controller (modulator_no_intc), and the second one will be with interrupt controller (modulator_intc). The idea was to illustrate how the same problem can be solved in a number of different ways.
modulator without interrupt controller:
#include "xparameters.h"
#include "xgpio.h"
#include "xstatus.h"
#include "xtmrctr.h"
#include "math.h"
/********************** Constant Definitions ***********************/
#define LED_CHANNEL 1 // GPIO channel (1 or 2) to operate on
#define SWITCH_CHANNEL 1 // GPIO channel (1 or 2) to operate on
#define XPS_TIMER_0 0 // timer counter of the device to operate on
#define SYS_CLK_MHZ 100 // 100 MHz system clock
#define f_low 1 // f_low = 1 Hz
#define f_high 3.5 // f_high = 3.5 Hz
#define DEPTH 8 // the number of samples in one period of the signal (2^8=256)
#define WIDTH 12 // the number of bits used to represent amplitude value (2^12=4096)
#define COUNT_DEPTH_END 1 << DEPTH // final threshold value for the depth counter (2^8=256)
/*********************** Variable Definitions ********************/
XGpio GpioLeds; // XGPIO instance that will be used to work with LED
XGpio GpioSwitches; // XGPIO instance that will be used to work with SWITCH
XTmrCtr TimerCounter; // TIMER instance
int count_depth; // counter for sine samples
int sw0; // switch used for selecting frequency
int scaling_factor; // will be used to represent the scaling_factor_0 or scaling_factor_1 value
int scaling_factor_0; // scaling_factor for f_low = 1 Hz (=95)
int scaling_factor_1; // scaling_factor for f_high = 3.5 Hz (=27)
int c1 = 1 << DEPTH; // 2^depth
int c2 = 1 << (WIDTH-1); // 2^(width-1)
int c3 = 1 << WIDTH; // 2^width
unsigned int clockRate; // system clock value, expressed in Hz
unsigned int End_Time_0; // threshold value for timer, when sw0 = 0 (f_low = 1 Hz)
unsigned int End_Time_1; // threshold value for timer, when sw0 = 1 (f_high = 3.5 Hz)
unsigned int End_Time; // will be used to represent the End_Time_0 or End_Time_1 value
unsigned int Current_Time; // represents the current timer value
unsigned int threshold; // will be used to represent the current value of the sine signal
int c; // variable that will be used for calculating div_factor_freqlow and div_factor_freqhigh
int div_factor_freqlow; // input clock division factor, when sw0 = 0 (f_low = 1 Hz)
int div_factor_freqhigh; // input clock division factor, when sw0 = 1 (f_high = 3.5 Hz)
unsigned int sine_ampl[COUNT_DEPTH_END]; // sine amplitude values that will be used to generate the PWM signal
/*********************** Initialization *****************************/
void Init()
{
// LEDs initialization
XGpio_Initialize(&GpioLeds, XPAR_AXI_GPIO_LED_DEVICE_ID);
XGpio_SetDataDirection(&GpioLeds, LED_CHANNEL, 0);
// SWITCHes initialization
XGpio_Initialize(&GpioSwitches, XPAR_AXI_GPIO_SWITCH_DEVICE_ID);
XGpio_SetDataDirection(&GpioSwitches, SWITCH_CHANNEL, 0xff);
// TIMER initialization
XTmrCtr_Initialize(&TimerCounter, XPAR_AXI_TIMER_0_DEVICE_ID);
XTmrCtr_SetOptions(&TimerCounter, XPS_TIMER_0, 0x0);
int i;
float pi = 4.0*atan(1.0); // pi=3.14...
for(i=0; i<256; i++)
//sine_ampl[i] = sin(2*pi*i/pow(2,depth)) * (pow(2,width-1)-1) + pow(2.0,width-1)-1;
sine_ampl[i] = (sin(2*pi*i/c1) * (c2-1) + c2 - 1); // [sin(2*pi*i/N)*(2^(width-1)-1)] + [2^(width-1)–1], N = 2^depth
clockRate = 1000000 * SYS_CLK_MHZ; // clockRate = 100000000 Hz (= 100 MHz)
int c = roundf ((float)clockRate / (float)(c1 * c3)); // c = SYS_CLK_MHZ / (2^depth * 2^width) = 95.3674
// input clock division factor, when sw0 = 0 (f_low = 1 Hz)
int div_factor_freqlow = (roundf((float)c / (float)f_low)) * c3; // div_factor_freqlow = (c / f_low) * 2^width = 389120
// input clock division factor, when sw0 = 1 (f_high = 3.5 Hz)
int div_factor_freqhigh = (roundf((float)c / (float)f_high)) * c3; // div_factor_freqhigh = (c / f_high) * 2^width = 110592
End_Time_0 = div_factor_freqlow; // End_Time_0 is timer threshold value, when sw0 = 0
End_Time_1 = div_factor_freqhigh; // End_Time_0 is timer threshold value, when sw0 = 1
scaling_factor_0 = roundf ((float)c / (float)f_low); // scaling_factor_0 = c / f_low (=95)
scaling_factor_1 = roundf((float)c / (float)f_high); // scaling_factor_1 = c / f_high (=27)
count_depth = 0; // counter_depth initialization
// read the switch position
sw0 = XGpio_DiscreteRead (&GpioSwitches, SWITCH_CHANNEL);
// check the switch position
if ((sw0 & 0x08) == 0) // masking (we want to check the status of SW0 only)
{
End_Time = End_Time_0;
scaling_factor = scaling_factor_0;
}
else
{
End_Time = End_Time_1;
scaling_factor = scaling_factor_1;
}
threshold = scaling_factor * sine_ampl[count_depth]; // threshold = current amplitude value of the sine signal
}
int main(void)
{
Init ();
while(1)
{
// start timer
XTmrCtr_Start(&TimerCounter, XPS_TIMER_0);
// read the switch position
sw0 = XGpio_DiscreteRead (&GpioSwitches, SWITCH_CHANNEL);
// check the switch position
if ((sw0 & 0x08) == 0) // masking (we want to check the status of SW0 only)
{
End_Time = End_Time_0;
scaling_factor = scaling_factor_0;
}
else
{
End_Time = End_Time_1;
scaling_factor = scaling_factor_1;
}
// turn on the LED
XGpio_DiscreteWrite(&GpioLeds, LED_CHANNEL, 0x80);
do // pause
{
Current_Time = XTmrCtr_GetValue(&TimerCounter, XPS_TIMER_0);
}
while(Current_Time<threshold);
//turn off the LED
XGpio_DiscreteWrite(&GpioLeds, LED_CHANNEL, 0);
do //pause
{
Current_Time = XTmrCtr_GetValue(&TimerCounter, XPS_TIMER_0);
}
while(Current_Time<End_Time);
// reset timer
XTmrCtr_Reset(&TimerCounter, XPS_TIMER_0);
count_depth ++;
if (count_depth == COUNT_DEPTH_END)
count_depth = 0;
threshold = scaling_factor * sine_ampl[count_depth];
// we must multiply current amplitude value of the sine signal with the scaling_factor
// (389120/4096=95) to "stretch" the range from (0 - 2^width(=4096)) to (0 - 389120)
}
return 0;
}
As you can see from the example above, we have used a lot of different functions.
- For LED and SWITCH initialization, we used
- XGpio_Initialize (XGpio *InstancePtr, u16 DeviceId) and
XGpio_SetDataDirection (XGpio *InstancePtr, unsigned Channel, u32 DirectionMask) functions
- For TIMER initialization, we used
- XTmrCtr_Initialize (XTmrCtr *InstancePtr, u16 DeviceId)
XTmrCtr_SetOptions (XTmrCtr *InstancePrt, u8 TmrCtrNumber, u32 Options) functions
- The rest of the functions that we have used for LEDs, SWITCHes and TIMER are:
- XGpio_DiscreteRead (XGpio *InstancePtr, unsigned Channel)
- XGpio_DiscreteWrite (XGpio *InstancePtr, unsigned Channel, u32 Mask)
- XTmrCtr_Start (XTmrCtr *InstancePtr, u8 TmrCtrNumber)
- XTmrCtr_GetValue (XTmrCtr *InstancePtr, u8 TmrCtrNumber)
- XTmrCtr_Reset (XTmrCtr *InstancePtr, u8 TmrCtrNumber)
All of these functions and it's definitions and explanations, you can find in the Xilinx directory:
Xilinx\SDK\2014.2\data\embeddedsw\XilinxProcessorIPLib\drivers\gpio_v... (or tmrctr_v... or some other peripheral)\doc\html\api\xgpio_8c.html (or xtmrctr_8c.html).
There, you can find a plenty of different functions that you can use in your software design. In this tutorial we have represent just those functions that we have used in our software design. Here are some of them:
-
XGpio_Initialize (XGpio *InstancePtr, u16 DeviceId)
- Initialize the XGpio instance provided by the caller based on the given DeviceID.
Parameters:
InstancePtr – is a pointer to an XGpio instance. The memory the pointer references must be pre-allocated by the caller. Further calls to manipulate the instance/driver through the XGpio API must be made with this pointer.
DeviceId – is the unique id of the device by the XGpio instance. Passing in a device id associates the generic XGpio instance to a specific device, as chosen by the caller or application developer.
Note: The exact DeviceId information you can find in the xparameters.h file. As you can see from the code above, we already include that file. The xparameters.h file contains base addresses of peripherals and defines parameters used to access peripherals in drivers and user programs. This file is automatically generated by Libgen (Library Generation) tool.
- xparameters.h file, you can find in your SDK project directory:
...\modulator\modulator.sdk\standalone_bsp_0\microblaze_0\include\ xparameters.h
-
XGpio_SetDataDirection (XGpio *InstancePtr, unsigned Channel, u32 DirectionMask)
- Set the input/output direction of all discrete signals for the specified GPIO channel.
Parameters:
InstancePtr – is a pointer to an XGpio instance to be worked on.
Channel - contains the channel of the GPIO (1 or 2) to operate on.
DirectionMask - is a bitmask specifying which discretes are input and which are output. Bits set to 0 are output and bits set to 1 are input.
Note: The exact DeviceId information you can find in the xparameters.h file.
-
XGpio_DiscreteRead (XGpio *InstancePtr, unsigned Channel)
- Read state of discretes for the specified GPIO channel.
Parameters:
InstancePtr - is a pointer to an XGpio instance to be worked on.
Channel - contains the channel of the GPIO (1 or 2) to operate on.
-
XGpio_DiscreteWrite (XGpio *InstancePtr, unsigned Channel, u32 Mask)
- Write to discretes register for the specified GPIO channel.
Parameters:
InstancePtr - is a pointer to an XGpio instance to be worked on.
Channel - contains the channel of the GPIO (1 or 2) to operate on.
Mask - is the value to be written to the discretes register.
-
XtmrCtr_Initialize (XtmrCtr *InstancePtr, u16 DeviceId)
- Initializes a specific timer/counter instance/driver. Initialize fields of the XTmrCtr structure, then reset the timer/counter
Parameters:
InstancePtr - is a pointer to the XTmrCtr instance.
DeviceId - is the unique id of the device controlled by this XTmrCtr component. Passing in a device id associates the generic XTmrCtr component to a specific device, as chosen by the caller or application developer.
Note: The exact DeviceId information you can find in the xparameters.h file.
-
XtmrCtr_SetOptions (XTmrCtr *InstancePrt, u8 TmrCtrNumber,
u32 Options)
- Enables the specified options for the specified timer counter. This function sets the options without regard to the current options of the driver. To prevent a loss of the current options, the user should call XTmrCtr_GetOptions() prior to this function and modify the retrieved options to pass into this function to prevent loss of the current options.
Parameters:
InstancePtr - is a pointer to the XTmrCtr instance.
TmrCtrNumber - is the timer counter of the device to operate on. Each device may contain multiple timer counters. The timer number is a zero based number with a range of 0 - (XTC_DEVICE_TIMER_COUNT - 1).
Options – contains the desired options to be set or cleared. Setting the option to '1' enables the option, clearing the to '0' disables the option. The options are bit masks such that multiple options may be set or cleared. The options are described in xtmrctr.h file.
-
XTmrCtr_Start (XTmrCtr *InstancePtr, u8 TmrCtrNumber)
- Starts the specified timer counter of the device such that it starts running. The timer counter is reset before it is started and the reset value is loaded into the timer counter.
- If interrupt mode is specified in the options, it is necessary for the caller to connect the interrupt handler of the timer/counter to the interrupt source, typically an interrupt controller, and enable the interrupt within the interrupt controller.
Parameters:
InstancePtr - is a pointer to the XTmrCtr instance.
TmrCtrNumber - is the timer counter of the device to operate on. Each device may contain multiple timer counters. The timer number is a zero based number with a range of 0 - (XTC_DEVICE_TIMER_COUNT - 1).
-
XTmrCtr_GetValue (XTmrCtr *InstancePtr, u8 TmrCtrNumber)
- Get the current value of the specified timer counter. The timer counter may be either incrementing or decrementing based upon the current mode of operation.
Parameters:
InstancePtr - is a pointer to the XTmrCtr instance.
TmrCtrNumber - is the timer counter of the device to operate on. Each device may contain multiple timer counters. The timer number is a zero based number with a range of 0 - (XTC_DEVICE_TIMER_COUNT - 1).
-
XTmrCtr_Reset (XTmrCtr *InstancePtr, u8 TmrCtrNumber)
- Resets the specified timer counter of the device. A reset causes the timer counter to set it's value to the reset value.
Parameters:
InstancePtr - is a pointer to the XTmrCtr instance.
TmrCtrNumber - is the timer counter of the device to operate on. Each device may contain multiple timer counters. The timer number is a zero based number with a range of 0 - (XTC_DEVICE_TIMER_COUNT - 1).
modulator with interrupt controller:
#include "xparameters.h"
#include "xgpio.h"
#include "xstatus.h"
#include "xtmrctr.h"
#include "math.h"
#include "xintc.h"
#include "mb_interface.h"
/********************** Constant Definitions ***********************/
#define LED_CHANNEL 1 // GPIO channel (1 or 2) to operate on
#define SWITCH_CHANNEL 1 // GPIO channel (1 or 2) to operate on
#define XPS_TIMER_0 0 // timer counter of the device to operate on
#define SYS_CLK_MHZ 100 // 100 MHz system clock
#define f_low 1 // f_low = 1 Hz
#define f_high 3.5 // f_high = 3.5 Hz
#define DEPTH 8 // the number of samples in one period of the signal (2^8=256)
#define WIDTH 12 // the number of bits used to represent amplitude value (2^12=4096)
#define COUNT_DEPTH_END 1 << DEPTH // final threshold value for the depth counter (2^8=256)
/*********************** Variable Definitions ********************/
XGpio GpioLeds; // XGPIO instance that will be used to work with LED
XGpio GpioSwitches; // XGPIO instance that will be used to work with SWITCH
XTmrCtr TimerCounter; // TIMER instance
XIntc InterruptController; // INTERRUPT CONTROLLER instance
int count_depth; // counter for sine samples
int sw0; // switch used for selecting frequency
int scaling_factor; // will be used to represent the scaling_factor_0 or scaling_factor_1 value
int scaling_factor_0; // scaling_factor for f_low = 1 Hz (=95)
int scaling_factor_1; // scaling_factor for f_high = 3.5 Hz (=27)
int c1 = 1 << DEPTH; // 2^depth
int c2 = 1 << (WIDTH-1); // 2^(width-1)
int c3 = 1 << WIDTH; // 2^width
unsigned int clockRate; // system clock value, expressed in Hz
unsigned int End_Time_0; // threshold value for timer, when sw0 = 0 (f_low = 1 Hz)
unsigned int End_Time_1; // threshold value for timer, when sw0 = 1 (f_high = 3.5 Hz)
unsigned int End_Time; // will be used to represent the End_Time_0 or End_Time_1 value
unsigned int Current_Time; // represents the current timer value
unsigned int threshold; // will be used to represent the current value of the sine signal
int c; // variable that will be used for calculating div_factor_freqlow and div_factor_freqhigh
int div_factor_freqlow; // input clock division factor, when sw0 = 0 (f_low = 1 Hz)
int div_factor_freqhigh; // input clock division factor, when sw0 = 1 (f_high = 3.5 Hz)
unsigned int sine_ampl[COUNT_DEPTH_END]; // sine amplitude values that will be used to generate the PWM signal
int led_state; // current state of the LED
int interrupt_occured; // variable which will signal when that interrupt has occured
int reset_value_0; // is the value for timer to now from which value will start counting downwards
// reset_value_0 = End_Time - threshold
int reset_value_1; // is the value for timer to now from which value will start counting downwards
// reset_value_1 = threshold
void Timer_InterruptHandler(void *CallBackRef, unsigned char TmrCtrNumber);
/*********************** Initialization *****************************/
void Init()
{
// LEDs initialization
XGpio_Initialize(&GpioLeds, XPAR_AXI_GPIO_LED_DEVICE_ID);
XGpio_SetDataDirection(&GpioLeds, LED_CHANNEL, 0);
// SWITCHes initialization
XGpio_Initialize(&GpioSwitches, XPAR_AXI_GPIO_SWITCH_DEVICE_ID);
XGpio_SetDataDirection(&GpioSwitches, SWITCH_CHANNEL, 0xff);
// INTERRUPT CONTROLLER initialization
XIntc_Initialize (&InterruptController, XPAR_MICROBLAZE_0_AXI_INTC_DEVICE_ID);
XIntc_Connect (&InterruptController, XPAR_MICROBLAZE_0_AXI_INTC_DEVICE_ID,
(XInterruptHandler)XTmrCtr_InterruptHandler, (void *)(&TimerCounter));
XIntc_Start (&InterruptController, XIN_REAL_MODE);
XIntc_Enable (&InterruptController, XPAR_MICROBLAZE_0_AXI_INTC_DEVICE_ID);
microblaze_enable_interrupts();
// TIMER initialization
XTmrCtr_Initialize(&TimerCounter, XPAR_AXI_TIMER_0_DEVICE_ID);
XTmrCtr_SetHandler(&TimerCounter, Timer_InterruptHandler, &TimerCounter);
XTmrCtr_SetOptions(&TimerCounter, XPS_TIMER_0, XTC_INT_MODE_OPTION | XTC_DOWN_COUNT_OPTION);
// TIMER configuration
int i;
float pi = 4.0*atan(1.0); // pi=3.14...
for(i=0; i<256; i++)
// [sin(2*pi*i/N)*(2^(width-1)-1)] + [2^(width-1)–1], N = 2^depth
// sine_ampl[i] = sin(2*pi*i/pow(2,depth)) * (pow(2,width-1)-1) + pow(2.0,width-1)-1;
sine_ampl[i] = (sin(2*pi*i/c1) * (c2-1) + c2 - 1);
clockRate = 1000000 * SYS_CLK_MHZ; // clockRate = 100000000 Hz (= 100 MHz)
int c = roundf ((float)clockRate / (float)(c1 * c3)); // c = SYS_CLK_MHZ / (2^depth * 2^width) = 95,3674
// input clock division factor, when sw0 = 0 (f_low = 1 Hz)
int div_factor_freqlow = (roundf((float)c / (float)f_low)) * c3; // div_factor_freqlow = (c / f_low) * 2^width = 389120
// input clock division factor, when sw0 = 1 (f_high = 3.5 Hz)
int div_factor_freqhigh = (roundf((float)c / (float)f_high)) * c3; // div_factor_freqhigh = (c / f_high) * 2^width = 110592
End_Time_0 = div_factor_freqlow; // End_Time_0 is timer threshold value, when sw0 = 0
End_Time_1 = div_factor_freqhigh; // End_Time_0 is timer threshold value, when sw0 = 1
scaling_factor_0 = roundf ((float)c / (float)f_low); // scaling_factor_0 = c / f_low (=95)
scaling_factor_1 = roundf((float)c / (float)f_high); // scaling_factor_1 = c / f_high (=27)
count_depth = 0; // counter_depth initialization
interrupt_occured = 0; // interrupt_occured initialization
// read the switch position
sw0 = XGpio_DiscreteRead (&GpioSwitches, SWITCH_CHANNEL);
// check the switch position
if ((sw0 & 0x08) == 0) // masking (we want to check the status of SW0 only)
{
End_Time = End_Time_0;
scaling_factor = scaling_factor_0;
}
else
{
End_Time = End_Time_1;
scaling_factor = scaling_factor_1;
}
threshold = scaling_factor * sine_ampl[count_depth]; // threshold = current amplitude value of the sine signal
// we must multiply current amplitude value of the sine signal with the scaling_factor
// (389120/4096=95) to "stretch" the range from (0 - 2^width(=4096)) to (0 - 389120)
reset_value_0 = End_Time - threshold;
reset_value_1 = threshold;
// set timer
XTmrCtr_SetResetValue(&TimerCounter, XPS_TIMER_0, reset_value_1);
// turn on the LED
XGpio_DiscreteWrite(&GpioLeds, LED_CHANNEL, 0x80);
// start timer
XTmrCtr_Start(&TimerCounter, XPS_TIMER_0);
led_state = 1;
}
// interrupt handler for the timer
void Timer_InterruptHandler(void *CallBackRef, unsigned char TmrCtrNumber)
{
interrupt_occured = 1;
}
int main(void)
{
Init ();
while(1)
{
// read the switch position
sw0 = XGpio_DiscreteRead (&GpioSwitches, SWITCH_CHANNEL);
// check the switch position
if ((sw0 & 0x08) == 0) // masking (we want to check the status of SW0 only)
{
End_Time = End_Time_0;
scaling_factor = scaling_factor_0;
}
else
{
End_Time = End_Time_1;
scaling_factor = scaling_factor_1;
}
if (interrupt_occured == 1)
{
interrupt_occured = 0;
// stop timer
XTmrCtr_Stop (&TimerCounter, XPS_TIMER_0);
if (led_state == 1)
{
// write the starting counter value, reset_value_0 = End_Time - threshold
XTmrCtr_SetResetValue(&TimerCounter, XPS_TIMER_0, reset_value_0);
// turn off the LED
XGpio_DiscreteWrite(&GpioLeds, LED_CHANNEL, 0);
// start timer
XTmrCtr_Start(&TimerCounter, XPS_TIMER_0);
led_state = 0;
count_depth ++;
if (count_depth == COUNT_DEPTH_END)
count_depth = 0;
threshold = scaling_factor * sine_ampl[count_depth];
reset_value_0 = End_Time - threshold;
reset_value_1 = threshold;
}
else
{
// write the starting counter value, reset_value_1 = threshold
XTmrCtr_SetResetValue(&TimerCounter, XPS_TIMER_0, reset_value_1);
// turn on the LED
XGpio_DiscreteWrite(&GpioLeds, LED_CHANNEL, 0x80);
// start timer
XTmrCtr_Start(&TimerCounter, XPS_TIMER_0);
led_state = 1;
}
}
}
return 0;
}
In the modulator_intc.c source code with the interrupt controller, we have used almost the same functions as in the modulator_no_intc.c source code without using an interrupt controller. Here are the functions that we have used in our design. Some of them are explained below the modulator_no_intc.c source file.
- For LED and SWITCH initialization, we used
- XGpio_Initialize (XGpio *InstancePtr, u16 DeviceId) and
XGpio_SetDataDirection (XGpio *InstancePtr, unsigned Channel, u32 DirectionMask) functions
- For TIMER initialization, we used
- XTmrCtr_Initialize (XTmrCtr *InstancePtr, u16 DeviceId)
XTmrCtr_SetOptions (XTmrCtr *InstancePrt, u8 TmrCtrNumber, u32 Options) functions
- XTmrCtr_SetHandler (XTmrCtr *InstancePtr, XTmrCtr Handler FuncPtr, void *CallBackRef)
- For INTERRUPT CONTROLLER initialization, we used
- XIntc_Initialize (XIntc *InstancePtr, u16 DeviceId)
- XIntc_Connect (XIntc *InstancePtr, u8 Id, XinterruptHandler Handler, void *Call BackRef)
- XIntc_Start (XIntc *InstancePtr, u8 Mode)
- XIntc_Enable (XIntc *InstancePtr, u8 Id)
- The rest of the functions that we have used for LEDs, SWITCHes, INTERRUPT CONTROLLER and TIMER are:
- XGpio_DiscreteRead (XGpio *InstancePtr, unsigned Channel)
- XGpio_DiscreteWrite (XGpio *InstancePtr, unsigned Channel, u32 Mask)
- XTmrCtr_Start (XTmrCtr *InstancePtr, u8 TmrCtrNumber)
- XTmrCtr_Stop (XTmrCtr *InstancePtr, u8 TmrCtrNumber)
- XTmrCtr_SetResetValue (XTmrCtr *InstancePtr, u8 TmrCtrNumber, u32 ResetValue)
Here are the explanation some of the functions that are used in modulator_intc.c source code with the interrupt controller, that are not mentioned before in this tutorial:
-
XTmrCtr_SetHandler (XTmrCtr *InstancePtr, XTmrCtr Handler FuncPtr, void *CallBackRef)
- Sets the timer callback function, which the driver calls when the specified timer times out.
Parameters:
InstancePtr - is a pointer to the XTmrCtr instance.
FunctionPtr - is the pointer to the callback function.
CallBackRef - is the upper layer callback reference passed back when the callback function is invoked.
-
XIntc_Initialize (XIntc *InstancePtr, u16 DeviceId)
- Initialize a specific interrupt controller instance/driver. The initialization entails:
- Initialize fields of the XIntc structure
- Initial vector table with stub function calls
- All interrupt sources are disabled
- Interrupt output is disabled
Parameters:
InstancePtr - is a pointer to the XIntc instance to be worked on.
DeviceId - is the unique id of the device controlled by this XIntc instance. Passing in a device id associates the generic XIntc instance to a specific device, as chosen by the caller or application developer.
Note: The exact DeviceId information you can find in the xparameters.h file.
-
XIntc_Connect (XIntc *InstancePtr, u8 Id, XinterruptHandler Handler, void *CallBackRef)
- Makes the connection between the Id of the interrupt source and the associated handler that is to run when the interrupt is recognized. The argument provided in this call as the Callbackref is used as the argument for the handler when it is called.
Parameters:
InstancePtr - is a pointer to the XIntc instance to be worked on.
Id - contains the ID of the interrupt source and should be in the range of 0 to XPAR_INTC_MAX_NUM_INTR_INPUTS - 1 with 0 being the highest priority interrupt.
Handler - to the handler for that interrupt.
CallBackRef - is the callback reference, usually the instance pointer of the connecting driver.
Note: The exact Id information you can find in the xparameters.h file.
-
XIntc_Start (XIntc *InstancePtr, u8 Mode)
- Starts the interrupt controller by enabling the output from the controller to the processor. Interrupts may be generated by the interrupt controller after this function is called.
- It is necessary for the caller to connect the interrupt handler of this component to the proper interrupt source.
Parameters:
InstancePtr - is a pointer to the XIntc instance to be worked on.
Mode - determines if software is allowed to simulate interrupts or real interrupts are allowed to occur. Note that these modes are mutually exclusive. The interrupt controller hardware resets in a mode that allows software to simulate interrupts until this mode is exited. It cannot be reentered once it has been exited.
-
XIntc_Enable (XIntc *InstancePtr, u8 Id)
- Enables the interrupt source provided as the argument Id. Any pending interrupt condition for the specified Id will occur after this function is called.
Parameters:
InstancePtr - is a pointer to the XIntc instance to be worked on.
Id - contains the ID of the interrupt source and should be in the range of 0 to XPAR_INTC_MAX_NUM_INTR_INPUTS - 1 with 0 being the highest priority interrupt.
Note: The exact Id information you can find in the xparameters.h file.
-
XTmrCtr_Stop (XTmrCtr *InstancePtr, u8 TmrCtrNumber)
- Stops the timer counter by disabling it.
- It is the callers' responsibility to disconnect the interrupt handler of the timer_counter from the interrupt source, typically an interrupt controller, and disable the interrupt within the interrupt controller.
Parameters:
InstancePtr - is a pointer to the XTmrCtr instance.
TmrCtrNumber - is the timer counter of the device to operate on. Each device may contain multiple timer counters. The timer number is a zero based number with a range of 0 - (XTC_DEVICE_TIMER_COUNT - 1).
-
XTmrCtr_SetResetValue (XTmrCtr *InstancePtr, u8 TmrCtrNumber, u32 ResetValue)
- Set the reset value for the specified timer counter. This is the value that is loaded into the timer counter when it is reset. This value is also loaded when the timer counter is started.
Parameters:
InstancePtr - is a pointer to the XTmrCtr instance.
TmrCtrNumber - is the timer counter of the device to operate on. Each device may contain multiple timer counters. The timer number is a zero based number with a range of 0 - (XTC_DEVICE_TIMER_COUNT - 1).
ResetValue - contains the value to be used to reset the timer counter.
3.4 Viewing and configuring Linker Script file
A linker is a program that takes one or more object files (.o) generated by a compiler and combines them into a single executable (.elf) file, see Illustration 3.12.
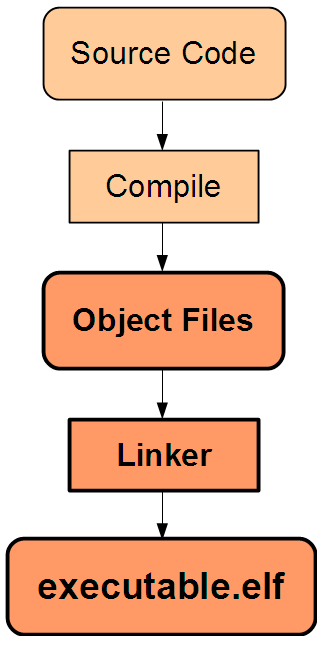
Illustration 3.12: Linking and Locating process
Linker program combines all files from the application project into the executable .elf file. This process is controlled by the Linker Script file.
Elf file is organized by logical section from each object file. Each section is located in a physical memory space as defined by the linker script. Relocatable symbols are resolved to their physical addresses. Other symbols, such as those for debugging are also added to the .elf file.
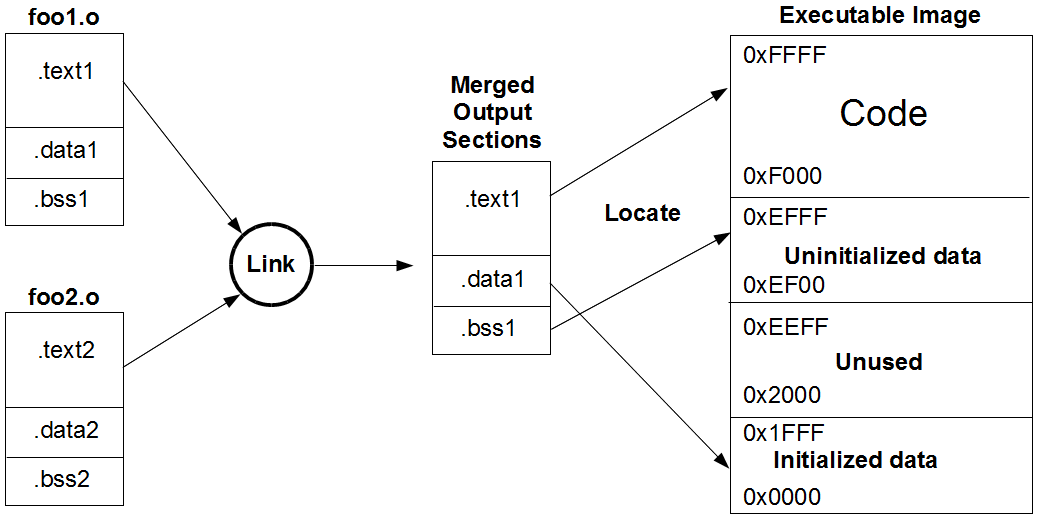
Illustration 3.13: Linker and Locator Flows
When the linker executes, it first combines all of the object sections. Then it resolves addresses and writes LDL files, see Illustration 3.13.
Linker Script controls the linking process. It maps the code and data to a specified memory space, sets the entry point to the executable, reserve space for the heap and stack, define the layout and start address of each section. Linker script is required if the design contains a discontinuous memory space. It has it's own language and can be difficult to write. Because of this, Xilinx provides a Linker Script Generator.
Linker Script will be automatically generated when you create an Xilinx C Project within Xilinx SDK tool. In our case it will be in the moment when we have created modulator_no_intc C project.
If you want to view or make some modifications to existing linker script file, please do the following:
- In the SDK Project Explorer tab, right-click on the modulator_no_intc project, select Generate Linker Script and the Linker Scrip dialog box will appear, see Illustration 3.14
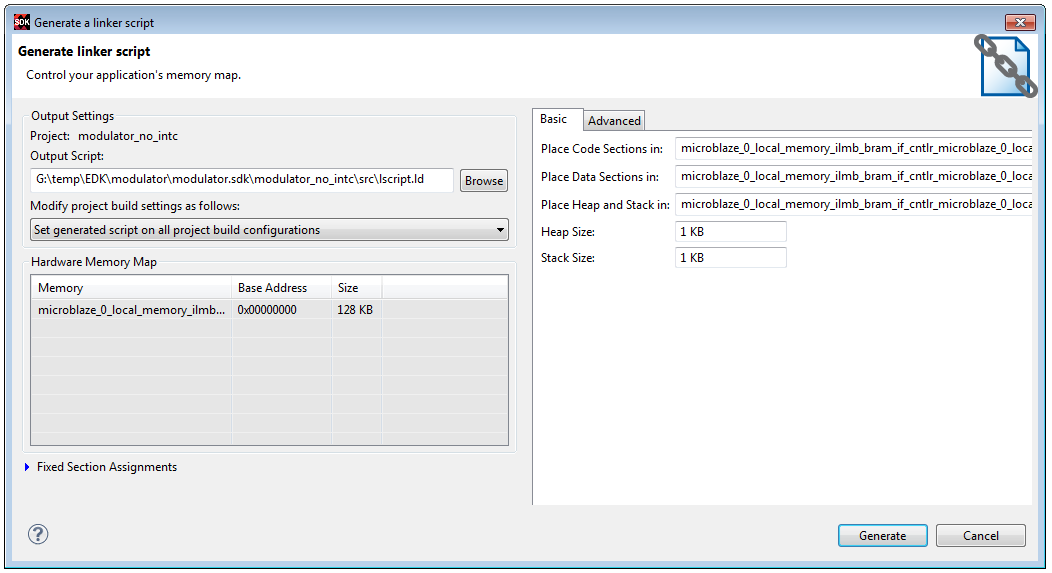
Illustration 3.14: Generate linker script dialog box
- If you want to modify the default settings for the Linker Script file, make the required modifications, click Generate button and the new linker script file will be created
3.5 Building application and generating ELF file
In a microprocessor-based design such as a MicroBlaze design, an ELF file generated in the SDK or in some other software development tool, can be imported and associated with a block design in the Vivado IDE. A bistream file can be generated that includes the ELF content from the Vivado IDE and run on target hardware.
To build an executable file for this application, SDK performs the following actions, see Illustration 3.15.
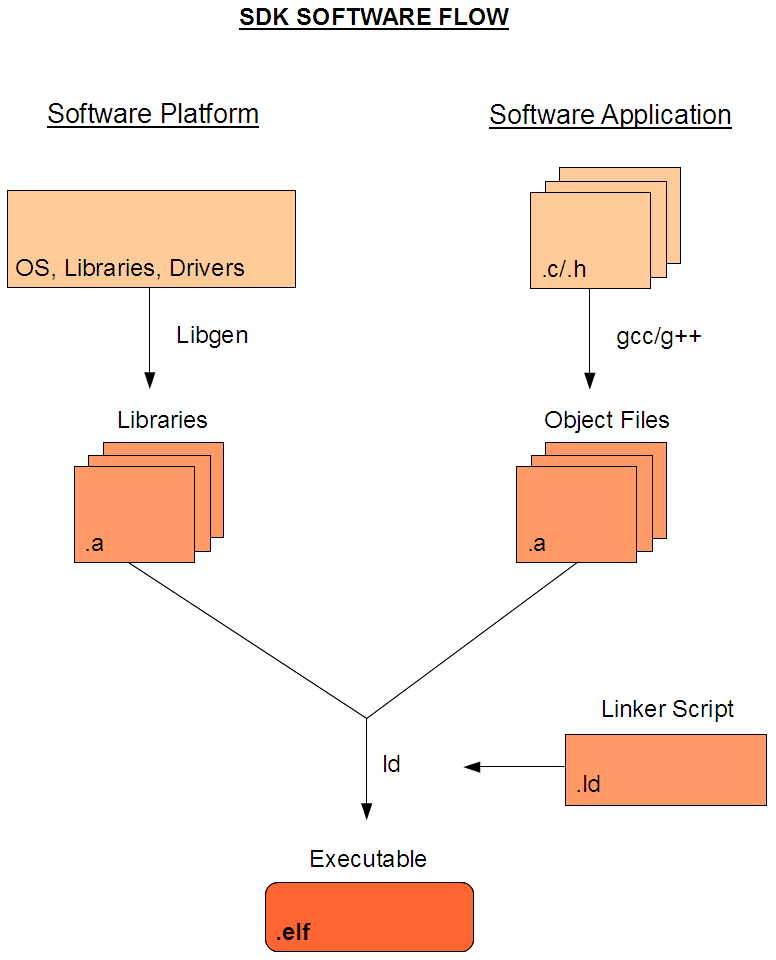
Illustration 3.15: SDK Software Flow
- First, SDK builds the Board Support Package (BSP) using LibGen tool. In our case it is called software platform.
- Then, SDK compiles the application software using platform-specific gcc/g++ compiler.
- At the end, the object files from the application and the BSP are linked together to form the final executable file (.elf file). This step is performed by a linker which takes as input a set of object files and a linker script that specifies where object files should be placed in memory.
SDK builds BSP ones, after it's creation. For every source file modification, SDK will automatically generate a new .elf file, compiling all source files that are out of date and linking them with the BSP.
The following sections provide an overview of concepts involved in building applications:
Makefiles
Compilation of source files into object files is controlled using Makefiles. With SDK, there are two possible options for Makefiles:
- Managed Make: For Managed Make projects, SDK automatically creates Makefiles. Makefiles created by SDK typically compile the sources into object files, and finally link the different object files into an executable. In most cases, managed make simply eliminates the job of writing Makefiles. This is the suggested option.
- Standard Make: If you want ultimate control over the compilation process, use standard make projects. In this case, you must manually write a Makefile with steps to compile and link an application. Using the standard Make flow hides a number of dependencies from SDK, so you must follow manual steps for other tasks such as debugging or running the application from within SDK. Therefore, the Standard Make flow is not recommended for general use.
Build Configurations
Software developers typically build different versions of executables, with different settings used to build those executables. For example, an application that is built for debugging uses a certain set of options (such as compiler flags and macro definitions), while the same application is built with a different set of options for eventual release to customers. SDK makes it easier to maintain these different profiles using the concept of build configurations.
Each build configuration could customize:
- Compiler Settings: Debug and Optimization levels
- Macros passed for compilation
- Linker Settings
3.6 Running Application
You can run your software application on your hardware platform using SDK tool. The program will run to termination. You can also stop the program at any time of execution. The run workflow is described in the following diagram, see Illustration 3.16.
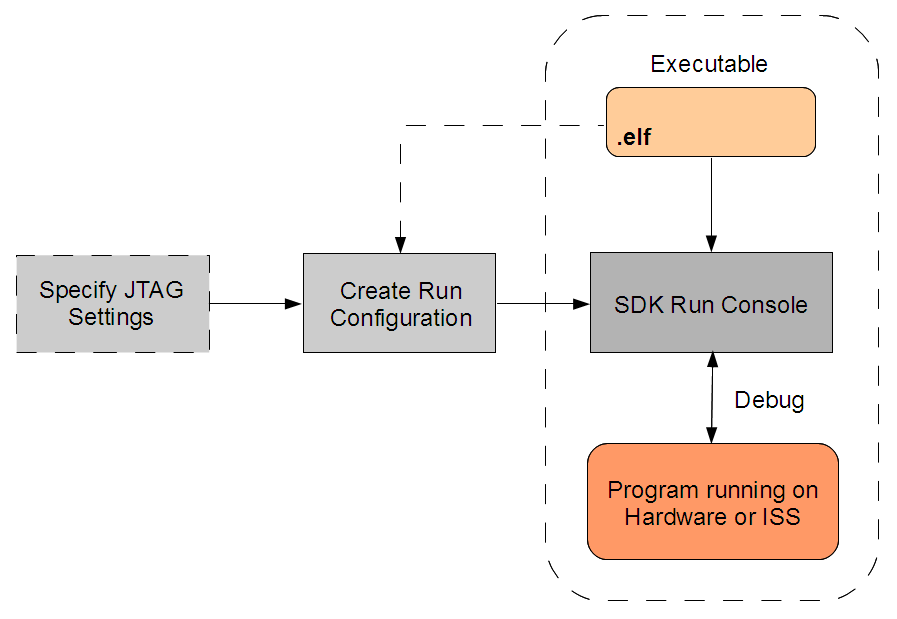
Illustration 3.16: Run Workflow diagram
The workflow is made up of the following components:
-
Executable ELF File: To debug your application, you must use a compiled Executable and Linkable Format (ELF) file.
-
Run Configuration: To launch the run session, you must create a run configuration in SDK. This configuration captures options required to start a run session, including the executable name, processor target to run and other information.
-
JTAG Settings: In most cases, SDK can automatically detect the JTAG settings and doesn't require special settings.
-
Run Console: This XMD console view enables you to stop the program execution or terminate the run session.
You can repeat the cycle of modifying the code, building the executable, and running the program in SDK. The program can be run on all supported debug targets.
Before you can run your application, you must generate netlist and bitstream file (if you didn't generate them after the hardware platform is specified) and download the FPGA's bitstream file to the board.
To generate netlist and bitstream file, go back to the Vivado IDE main window and follow the same steps as it is explained in the Chapter 2.3 Create an IP Integrator Design, steps 47, 48 and 49.
To download your bitstream file to the target board, do the following:
-
Select Xilinx Tools → Program FPGA from the SDK main window
-
In the Program FPGA dialog box:
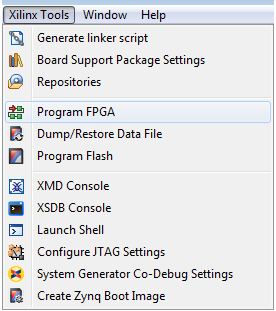
Illustration 3.17: Program FPGA option
-
For Hardware Configuration:
- set Hardware Platform to be modulator_wrapper_hw_platform_0
- set Connection to be Local
For Software Configuration:
- choose in the EFF File to Initialize in Block RAM drop-down many modulator_no_intc.elf file
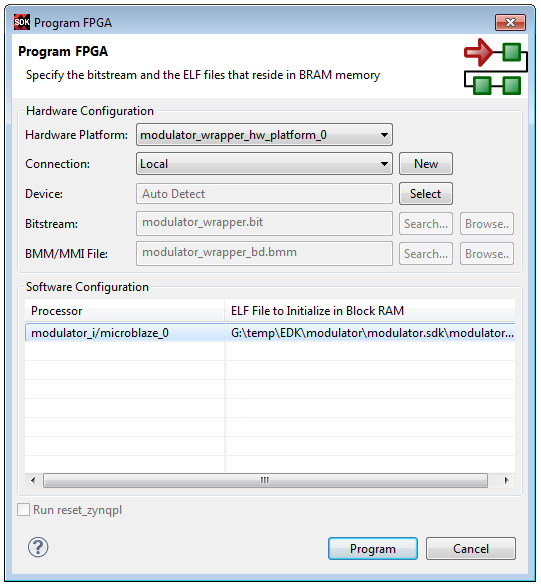
Illustration 3.18: Program FPGA dialog box
-
Click Program and your updated bitstream file with the .elf file will be downloaded into the target FPGA device, see Illustration 3.19
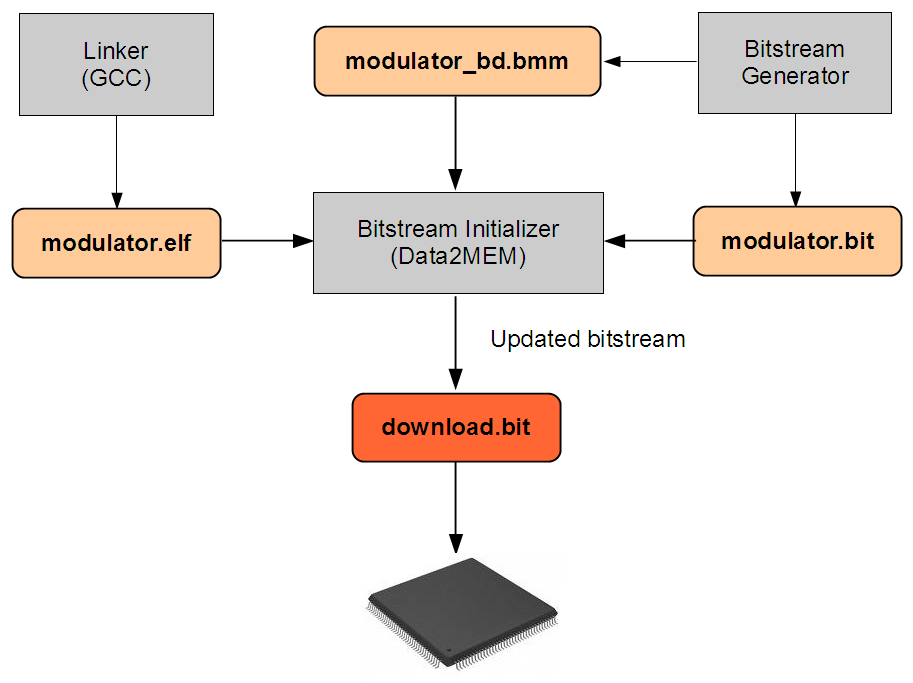
Illustration 3.19: Program FPGA flow
A Block RAM Memory Map (BMM) file is a text file that has syntactic descriptions of how individual block RAMs constitute a contiguous logical data space. When updating the FPGA bitstream with memory initialization data (typically the executable program), the Data2MEM utility uses the BMM file to direct the translation of data into the proper initialization form. Although the BMM file is a text file direct editing is not recommended. This file is generated by the PlatGen (Platform Generator) tool and updated with physical location information by the BitGen (Bitstream Generator) tool.
3.7 Application Debugging
Debugging is an integral part of embedded systems development. The debugging process implies testing, stabilizing, localizing and correcting errors. There are two methods of debugging:
- Hardware debugging via logic probe, logic analyzer, on-circuit emulator, or background debugger
- Software debugging via a debugging instrument
SDK supports software debugging through:
-
GDB tools
GDB (GNU Debugger) is a powerful, flexible tool that provides a unified graphical interface for debugging and verifying MicroBlaze processor systems during various development phases. With GDB debugger you can debug programs written in C and C++.
-
Xilinx Microprocessor Debugger (XMD)
- Runs all the hardware debugging tools and communicates with the hardware
- Shell for hardware communication
- Tool command language (Tcl) syntax and command interpreter
-
GNU tools
- Communicate with the hardware through XMD
The actual debugger is XMD. GDB is the user interface, or GUI, that talks to XMD through a TCP/IP port via Tcl commands, see Illustration 3.20.
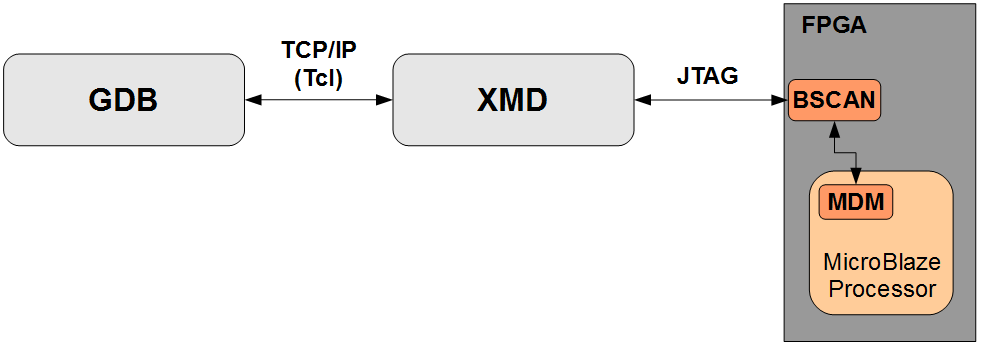
Illustration 3.20: GDB overview
The main purpose of XMD is to attach to the debug hardware interface of the embedded processor, the MicroBlaze Debug Module (MDM). This is done via an internal JTAG chain facilitated by the BSCAN component on the FPGA. The MDM also offers a JTAG uart feature that will show up as a AXI bus uart peripheral for the MicroBlaze. XMD provides many services, including download cable connection and control. One of the main functions of XMD is the debug engine. This engine provides the command interface to the processor debug hardware via a Tcl script and/or simple command line interface. You could directly debug a program from the XMD command line console, but this would be a painful process. The GDB debugger provides an easy-to-use graphical interface that interfaces Tcl with XMD.
3.7.1 Debug Overview
With the SDK debugger, you can see what is happening to a program while it executes. You can set breakpoints or watchpoints to stop the processor, step through program execution, view the program variables and stack, and view the contents of the memory in the system. The SDK debugger uses the GNU Debugger (GDB) with Xilinx Microprocessor Debugger (XMD) as the underlying debug engine. It translates each user interface action into a sequence of GDB commands and processes the output from GDB to display the current state of the program being debugged. It communicates to the processor on the hardware and Instruction Set Simulator (ISS) target using XMD.
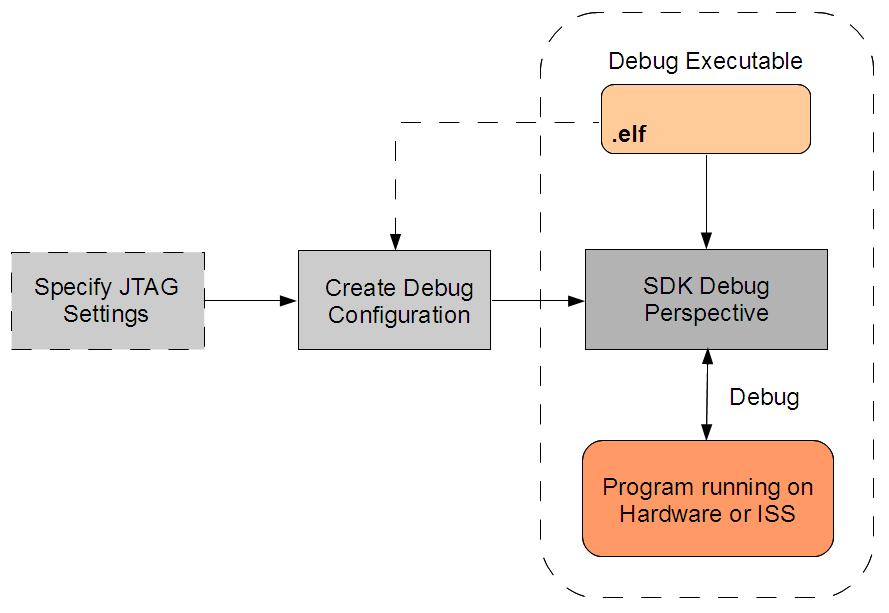
Illustration 3.21: Debug Workflow diagram
The workflow is made up of the following components:
-
Executable ELF File: To debug your application, you must use an Executable and Linkable Format (ELF) file compiled for debugging. The debug ELF file contains additional debug information for the debugger to make direct associations between the source code and the binaries generated from that original source.
-
Debug Configuration: In order to launch the debug session, you must create a debug configuration in SDK. This configuration captures options required to start a debug session, including the executable name, processor target to debug, and other information.
-
JTAG Settings: When debugging the program on a hardware target, SDK uses XMD for communication to the processor using a JTAG interface on the board. The JTAG settings for the debug session can be specified in the JTAG Settings dialog box. In most cases, the debugger can automatically detect the JTAG settings and do not need to provide special settings.
-
SDK Debug Perspective: Using the Debug perspective, you can manage the debugging or running of a program in the Workbench. You can control the execution of your program by setting breakpoints, suspending launched programs, stepping through your code, and examining the contents of variables.
You can repeat the cycle of modifying the code, building the executable, and debugging the program in the SDK.
Note: If you edit the source code after compiling, the line numbering will be out of step because the debug information is tied directly to the source. Similarly, debugging optimized binaries can also cause unexpected jumps in the execution trace.
Hardware debug target
SDK supports debugging of a program on processor running on a FPGA. All processor architectures are supported. SDK communicates to the processor on the FPGA over the JTAG interface using the Xilinx JTAG cable. Before you debug the processor on the FPGA, you should configure the FPGA with the appropriate system bitstream.
The debug logic for each processor enables program debugging by controlling the processor execution. The debug logic on hard ARM processor cores is built in and always available for debugging. However, the debug logic on soft MicroBlaze processor cores is configurable and can be enabled or disabled by the hardware designer when building the embedded hardware.
Enabling the debug logic on MicroBlaze processors provides advanced debugging capabilities such as hardware breakpoints, read/write memory watchpoints, safe-mode debugging, and more visibility into MicroBlaze processors. This is the recommended method of debugging MicroBlaze software.
If the debug logic is disabled on the hardware, you can debug programs using XMDStub (a ROM monitor). XMDStub is a small debug stub that runs on MicroBlaze processors and can perform basic debug operations such as reading and writing memory and register values and controlling the program execution. It should be initialized to the processor local memory at the reset location, so when the processor resets, the XMDStub is run and ready for debugging. It communicates to XMD over a Universal Asynchronous Receiver-Transmitter (UART), which could be JTAG-based or RS232-based. This method is not supported in SDK and you should use the XMD command-line tool for debugging.
3.7.2 Debug Configuration
To debug, run, and profile an application, you must create a configuration that captures the settings for executing the application. The configurations for debugging, running, and profiling an application are similar.
To setup a debug configuration, do the following:
-
In the SDK main window, select modulator_no_intc project and select Run → Debug Configurations... option, see Illustration 3.22
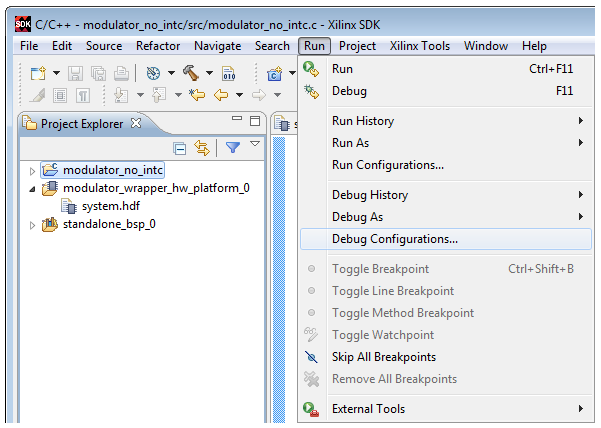
Illustration 3.22: Debug Configurations option
The another way to open Debug Configurations dialog box is to select modulator_no_intc project in the Project Explorer window, right-click on it and choose Debug As → Debug Configurations... option
-
In the Debug Configurations dialog box, right-click on the Xilinx C/C++ application (System Debug) and choose New option, or click on the New launch configuration button on the upper left corner of the window to create a configuration of the selected type, see Illustration 3.23
-
You can see that SDK automatically create new modulator_no_intc Debug configuration for us, see Illustration 3.24
-
Click Debug
The ELF file will be downloaded to the FPGA into the bootloop placeholder space in the betstream.
-
If the Confirm Perspective Switch dialog box appears, click Yes to switch to the Debug perspective. You can also switch to this perspective by clicking on the Debug button on the top right bar, see Illustration 3.26
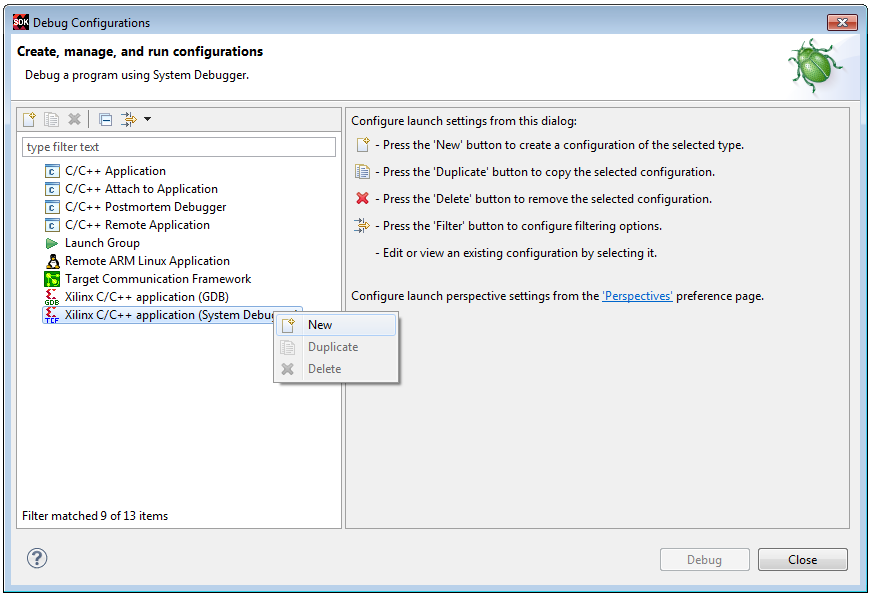
Illustration 3.23: Creating a new configuration of the selected type
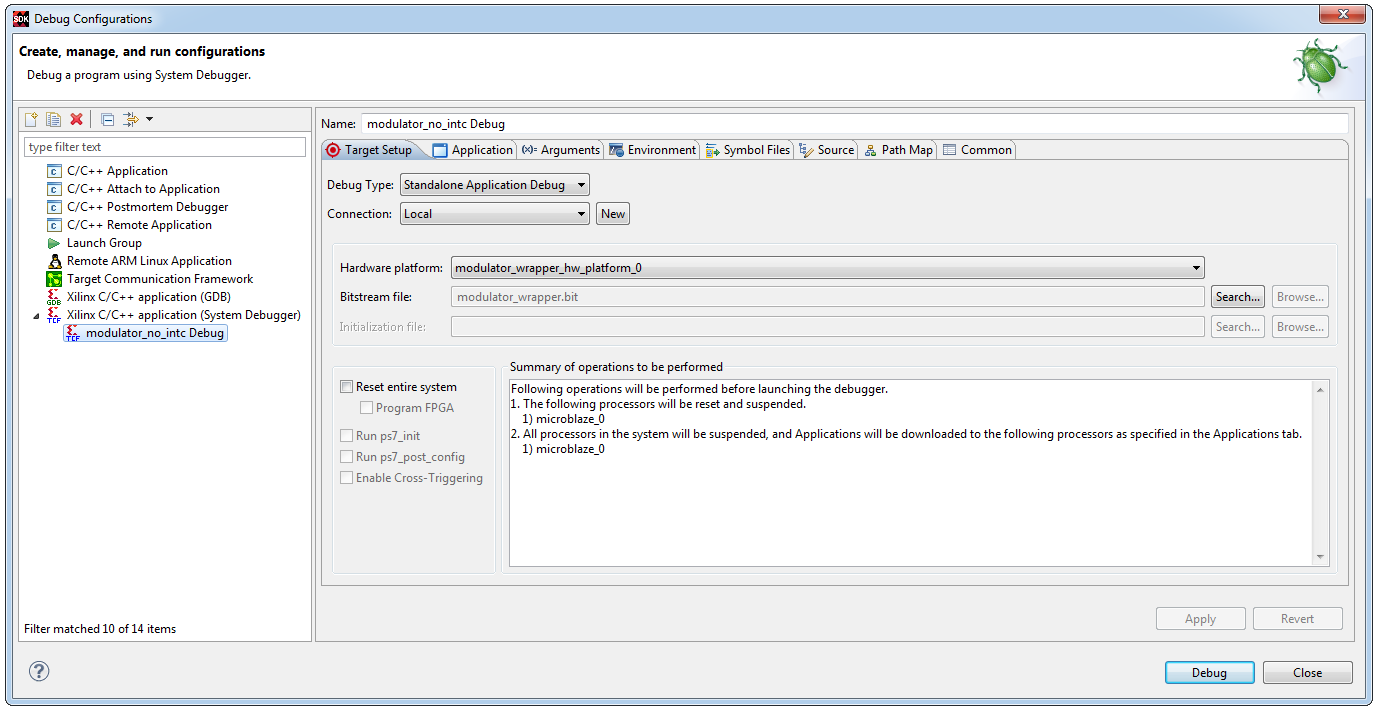
Illustration 3.24: Automatically generated “modulator_no_intc Debug” configuration by the SDK
As you can see, you can provide an unique name for your configuration and select the application executable to use for execution. Select the appropriate executable for debug configurations, see Illustration 3.25. You only need to create the configuration once for the first execution of the application. For subsequent execution of the application, you can select the configuration from the Debug drop-down list in the toolbar.
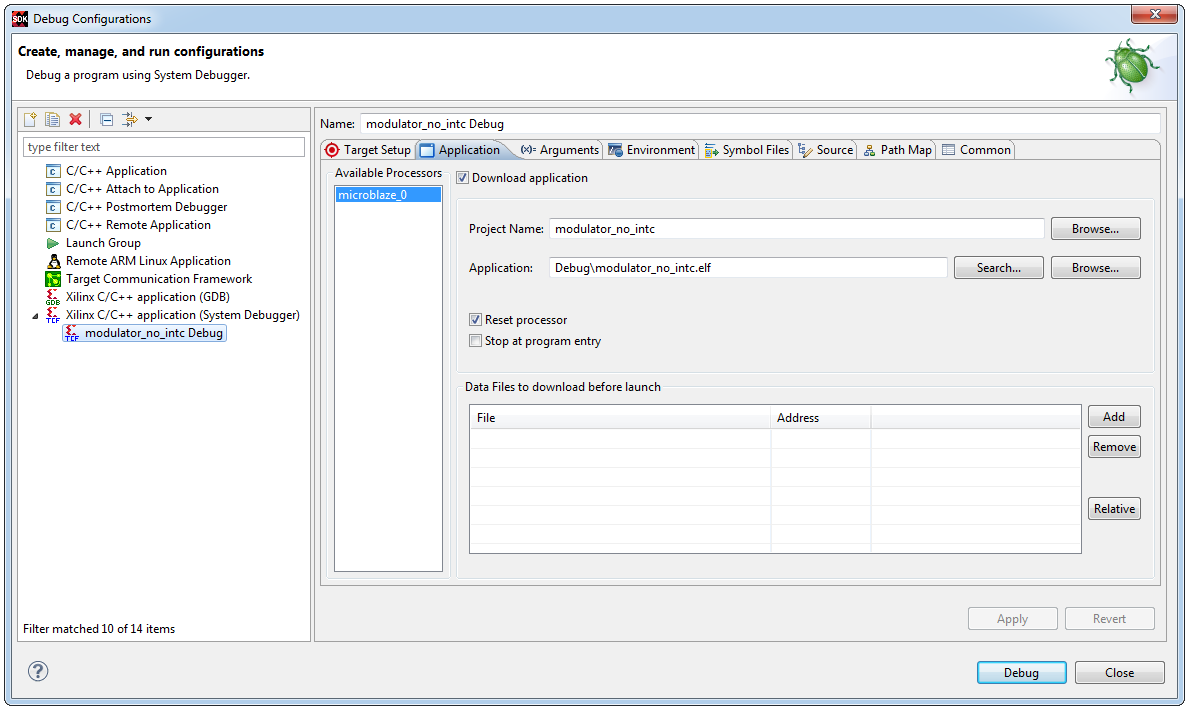
Illustration 3.25: Application tab
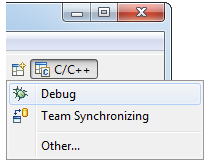
Illustration 3.26: Debug button
3.7.3 Debug Perspective
The Debug perspective lets you manage the debugging or running of a program in the Workbench. You can control the execution of your program by setting breakpoints, suspending launched programs, stepping through your code, and examining the content of variavles.
The Debug perspective displays the following information:
-
Each program running on the processor (represented as a node in the tree)
-
The stack frame for the suspended program that you are debugging
The Debug perspective also drives the C/C++ Editor. As you step through your program, the C/C++ Editor highlights the location of the execution pointer, see Illustration 3.27.
-
The Debug perspective will open, showing the modulator_no_intc.c source file in the source view, various variables defined in the file in the Variables view, Outline view showing the objects which are in the current scope, thread created and the program suspended in the Debug view. Note that the program operation is suspended at the first executable statement (at the main() entry point), see Illustration 3.27.
-
First we will illustrate the usage of Step Into, Step Over and Step Return commands. As already noted, after debugging process is started, program operation will suspend at the first executable statement. In modulator_no_intc.c source code first executable statement is the Init() function call, as shown on the Illustration 3.27. We can use Step Into
 button to enter into the Init() function in order to overview the function execution in more details. After you press the Step Into button twice, debugger will automatically jump to the first executable statement of the Init() function as shown on the Illustration 3.28.
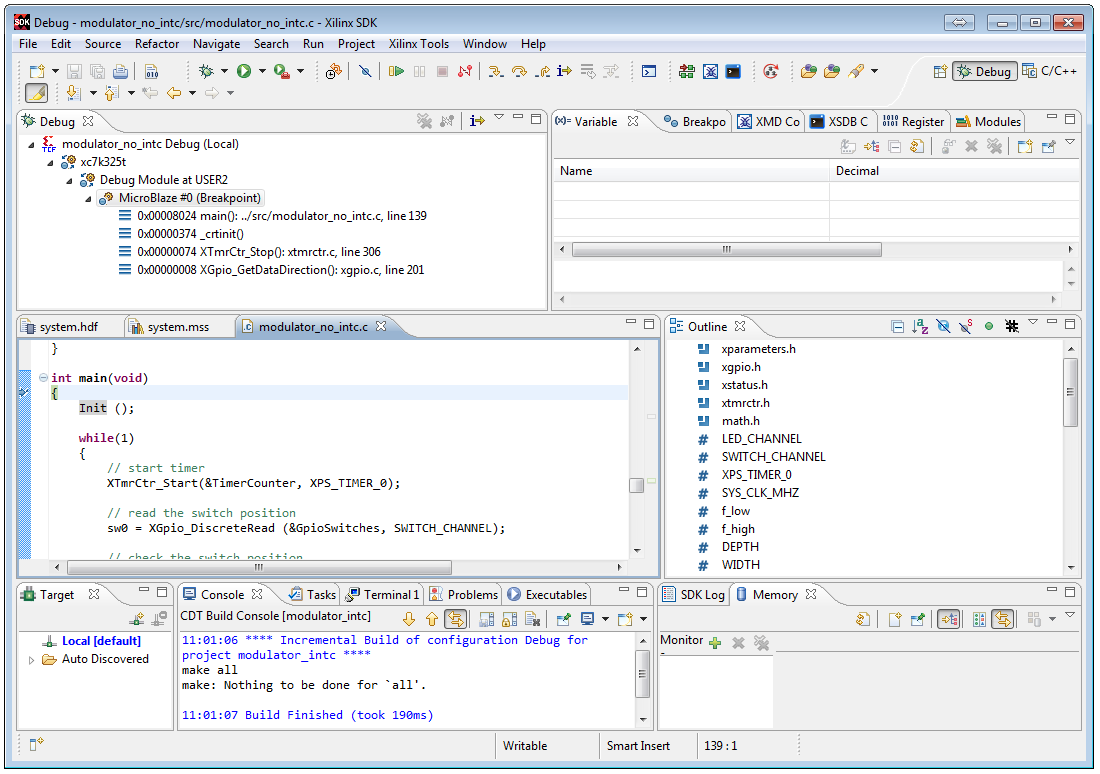
Illustration 3.27: SDK Debug Perspective
In the process of debugging the most important task is adding breakpoints to halt program execution at the user specified points. Once program execution is suspended, user can use Step Into  , Step Over
  , Step Return
  and Resume
  commands to control program execution from the encountered breakpoint. These commands, together with variables and memory views, enable user to have total control and overview of the program execution process during debugging.
Following steps will illustrate how these commands can be used in debug process.
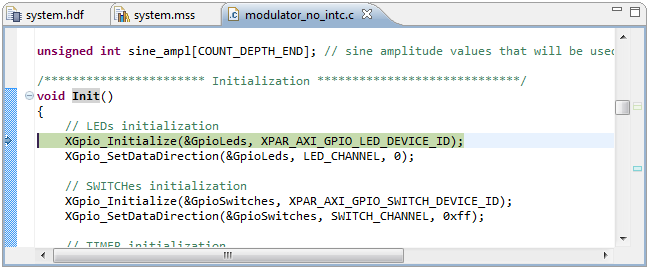
Illustration 3.28: Result of the execution of the Step Into command on the Init() function
-
As can be seen from the previous illustration, first executable statement of the Init() function is yet another function call, this time to the Xilinx provided function for the GPIO initialization, XGpio_Initialize. If you would like to examine the GPIO initialization process in more detail, you can press the Step Into button once more. After this, debugger will step into the XGpio_Initialize function and suspend program execution at the first executable statement in this function once more, as shown on the Illustration 3.29.
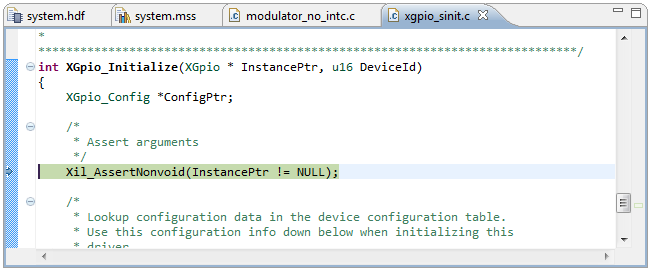
Illustration 3.29: Result of the execution of the Step Into command on the XGpio_Initialize function
-
While the debugger is working within a function call, you can use Step Return
 button to execute all remaining statements within a function in order to quickly return to the point where a function has been called. In our case if we press Step Return button once, debugger will execute all remaining statements within the XGpio_Initialize function and return to the Init() function, because XGpio_Initialize function has been called from the Init() function, and suspend program execution at the next executable statement, which in our case is yet another function call, this time to the XGpio_SetDataDirection function, as shown on the Illustration 3.30.
 -
Although Step Into command can be very useful in the process of program debugging, quite often we are not interested into details of every function execution. If we would like to skip over known working functions, because we have debugged them previously, we can use Step Over
 button that will execute the complete function in one step, treating C function calls as a single C statement. Please notice that our program that we are currently debugging has suspended execution at the XGpio_SetDataDirection function call as shown on the previous illustration. If you are not interested in the details of the execution of this function, you can execute it at once by clicking on the Step Over button. Debugger will now execute all the statements within the XGpio_SetDataDirection function and only then suspend the program execution once more, after reaching the first executable statement located after the XGpio_SetDataDirection function, in our case this would be another XGpio_Initialize function call, as shown on the Illustration 3.31.
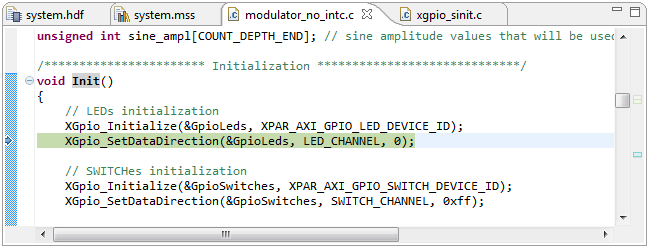
Illustration 3.30: Result of Step Return command execution within XGpio_Initialize function
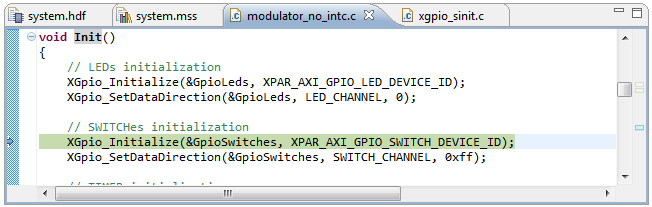
Illustration 3.31: Result of the execution of the Step Over command on the XGpio_Initialize function
Breakpoints
Next we will illustrate how to use breakpoints to suspend program execution at the user-selected line of program code. A breakpoint suspends the execution of a program at the location where the breakpoint is set. By default, SDK sets breakpoints at main( ) and exit( ) functions. When you start a debug session, the processor stops at the start of the main( ) function of the program. There are two types of breakpoints used by the debugger:
-
Software Breakpoint - To set a software breakpoint, the debugger modifies the program instruction at the breakpoint address. The debugger does not require any hardware resources for setting a software breakpoint, so you can essentially set any number of software breakpoints in your debug session. The debugger requires access to read and write to the breakpoint address location. This is the default breakpoint used by the debugger.
-
Hardware Breakpoint - To set a hardware breakpoint, the debugger does not require modification of the program instruction at the breakpoint address. Each processor provides a limited set of hardware breakpoints. In the case of MicroBlaze processors, this is configurable and set by the hardware developer and should be used wisely. You should use hardware breakpoints when the debugger cannot read or write to the program memory, such as when using Flash memory.
-
We will place the first breakpoint at the line 97, where variable pi is declared and initialised. To do so point the mouse to the line 97 and right-click on the blue stripe located on the left border of the Sources window. A drop-down menu will appear from which Add Breakpoint... option should be selected, see Illustration 3.32.
-
When you select Add Breakpoint... option a Properties for C/C++ Line Breakpoint dialog box will appear allowing you to specify the properties of the new breakpoint as shown on the Illustration 3.33. Since we want to add a simple breakpoint at this moment, we don't have to change anything, so simply click OK.
-
After you have added a new breakpoint, its location in the program code will be made visible by the blue circle marker located on the blue stripe just left of the program code line for which the breakpoint was specified, see Illustration 3.34.
-
Please remember that our program execution is currently suspended at line 88 and that there are several executable statements located between this line and line 97 where our breakpoint is located. These statements need to be executed before reaching the breakpoint. These executable statements can be executed by pressing the Step Over button appropriate number of times until we reach line 97. However, this would be a very inefficient way of program debugging. Instead we can use Resume
 button to quickly execute all executable statements between our current position and the breakpoint position.
 -
After we have pressed Resume button, debugger will execute all necessary statements until it reaches a breakpoint set at line 97 and then suspend program execution. As show on the Illustration 3.35.
-
We have now reached the section of the code where variable pi will be declared and initialised. To monitor the variable pi initialization process we can use the Variables tab of the debugger perspective. Currently variable pi is uninitialised which can be seen by inspecting it's current value in the Variables tab, see Illustration 3.36.
-
Next we will execute line 97 by pressing the Step Over button once and inspect the change in the variable pi value once more. After the step over command is executed by the debugger it will suspend program execution at the next executable statement located just below line 97 and also update the content of the Variables tab as show on the Illustration 3.37. In the Variables tab we can now see that variable pi has changed it's value to 3.141593 which is the correct initial value of the pi variable.
-
Next we will illustrate how the Memory tab can be used to monitor the content of the array variables. Please notice that program execution is suspended at line 99, where a for loop is located that is used to initialize sine_ampl array. We will use the Monitor tab to overlook this initialization process. First thing that must done is to determine the base address at which the sine_ampl array is stored in the memory. To do so, go over the sine_ampl text, located at line 101. A new window will appear displaying the content of sine_ampl array as well as information about it's type, size and base address value as show in the Illustration 3.38. Please notice that in our case sine_ampl array is stored in the memory starting from the address 0x9350.
-
In the Memory tab, click on the Add Memory Monitor button. A new dialog box will appear where we should specify the address or expression to monitor. In our case we will specify the starting address of the sine_ampl array, 0x9350, see Illustration 3.39. After you do so, click OK.
-
In the Memory tab, please notice that a new Memory monitor has been added, monitoring the memory content starting from the address 0x9350 as shown on the Illustration 3.40. Currently the content of all memory locations staring from the address 0x9350 is 0x00000000. This is fine, since we still have not initialized the sine_ampl array.
-
Let us initialize the first member of the sine_ampl array, with index value 0. Please press Step Over button once. After the first step over command, debugger will execute the for statement. Since this is the first time this statement is executed it will be set to value of the iterator variable i to the value 0, as specified by the for statement. This change of the variable i value is also indicated in the Variables tab, where line holding the variable i is coloured yellow and holds the new value for the variable i, see Illustration 3.41.
-
Press Step Over button once more. This time debugger will execute the line of code that initialises sine_ampl array member with index value i=0. After debugger finishes executing this line of code it will suspend program execution and update the Memory tab as shown on the Illustration 3.42. If you inspect the value stored at the memory location 0x9350, you can see that it has changed from 0x00000000 to 0x000007FF which is the correct initial value for the sine_ampl[0] array member.
-
There is an alternative way of viewing the sine_ampl array content. If you place mouse pointer on the sine_ampl text located at line 101, a new window will appear where you can inspect the content of the array. Expand the [0..99] line to see the content of the sine_ampl[0] member, as shown on the Illustration 3.43.
-
Finally, we will create a conditional breakpoint in order to stop the sine_ampl initialization process after a specified number of array element have been initialized. Right-click on the blue stripe just left of the line 101 and select Add Breakpoint... option once more. Properties for C/C++ Line Breakpoint dialog box will appear as before. Since now we would like to place a conditional breakpoint we must specify breakpoint condition using the Condition field. In this example we would like to break a program execution when loop iterator i reaches the value 5. This would mean that debugger should stop sine_ampl array initialization process after sine_ampl members 0-4 have been initialized. To specify this condition type i==5 in the Condition field as show on the Illustration 3.44 and press OK button to complete the conditional breakpoint setup.
-
You can verify that a new conditional breakpoint has been placed at the line 101 which is designated by the blue circle located on the blue stripe just left to the line 101. Since this breakpoint is conditional breakpoint, next to the blue circle a question marker is also visible as shown on the Illustration 3.45.
-
Press Resume button to continue program execution. Debugger will continue initialising sine_ampl array until it reaches the condition specified in the conditional breakpoint located at line 101. This will happen when loop iterator i reaches the value of 5. After this condition is met, debugger will suspend program execution and display the current content of sine_ampl array in the memory tab as show on the Illustration 3.46. Please notice that sine_ampl members with index values 0-4 have already been initialised to appropriate values, because memory locations with addresses from 0x9350 to 0x9360 have values that are different from 0. Since sine_ampl array is an array of unsigned integers, each array member occupies one double word in the memory. This means that sine_ampl members with index values 0-4 should occupied memory block starting from 0x9350 to 0x9360, which is exactly the memory block that has values different from 0 as show in the Memory tab.
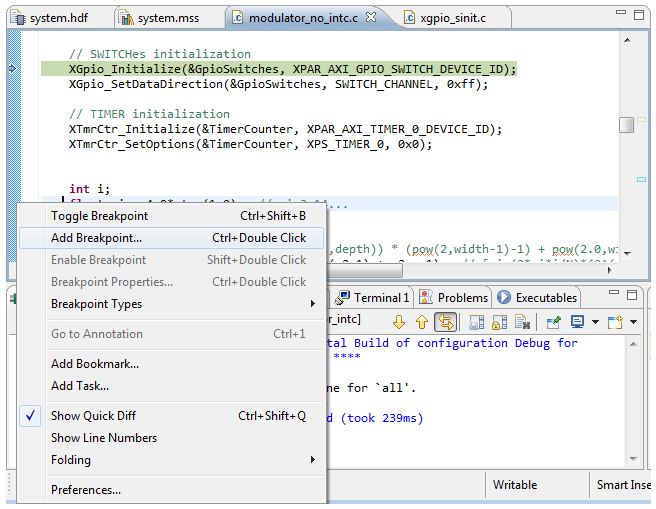
Illustration 3.32: Add Breakpoint option
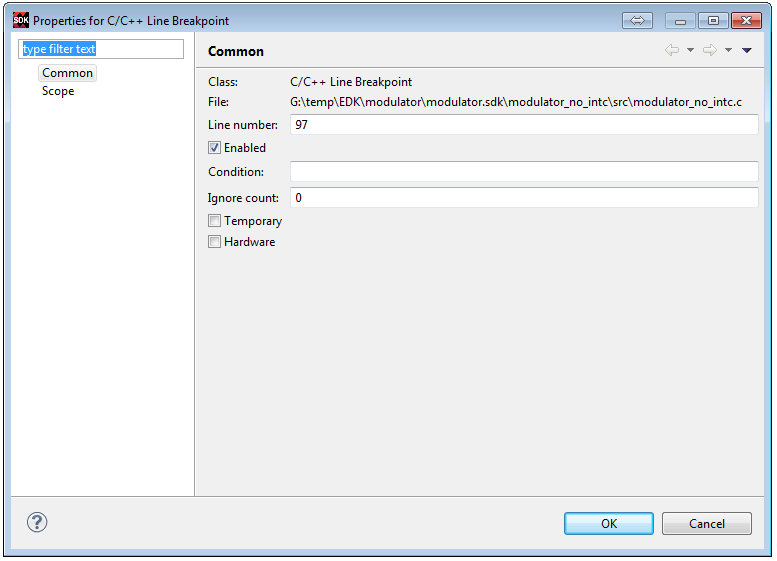
Illustration 3.33: Properties for C/C++ Line Breakpoint dialog box
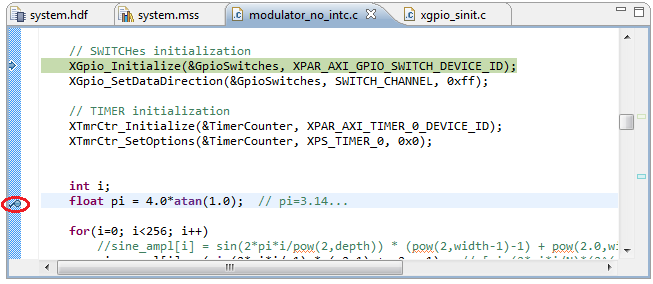
Illustration 3.34: Breakpoint added
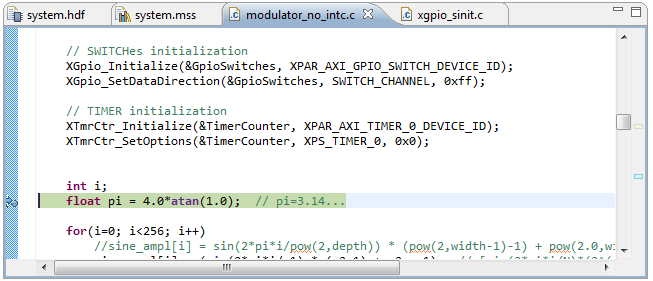
Illustration 3.35: Breakpoint reached
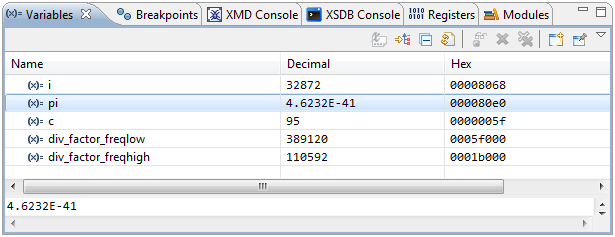
Illustration 3.36: Variables tab before variable pi initialization
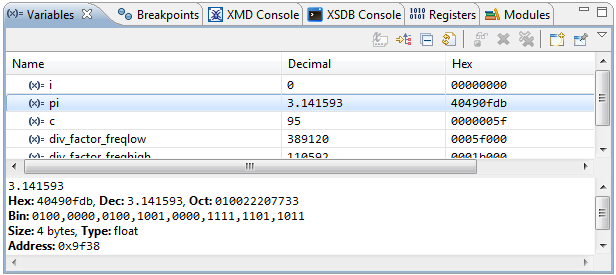
Illustration 3.37: Variables tab after variable pi initialization
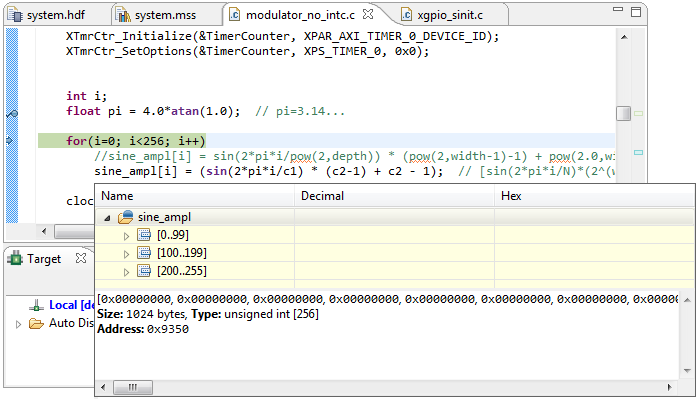
Illustration 3.38: sine_ampl array info
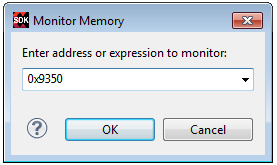
Illustration 3.39: Monitor Memory dialog box
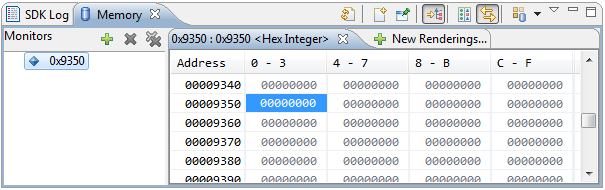
Illustration 3.40: Content of the sine_ampl array in Memory window before array initialization
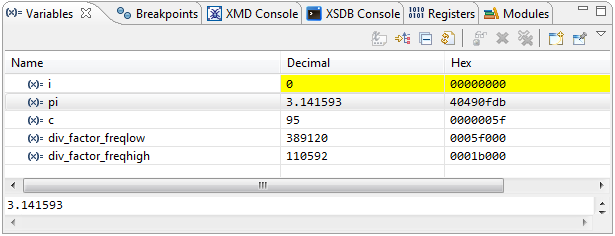
Illustration 3.41: Change of i variable value indication in the Variables tab
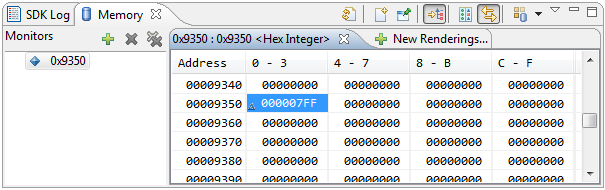
Illustration 3.42: Indication of the change of the sine_ampl value in Memory window
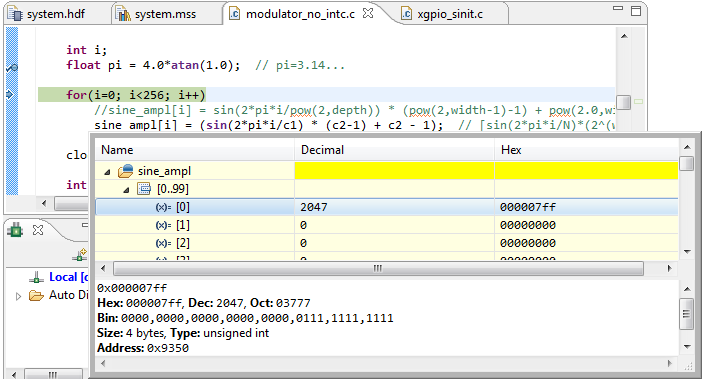
Illustration 3.43: Alternatively way of viewing sine_ampl array content
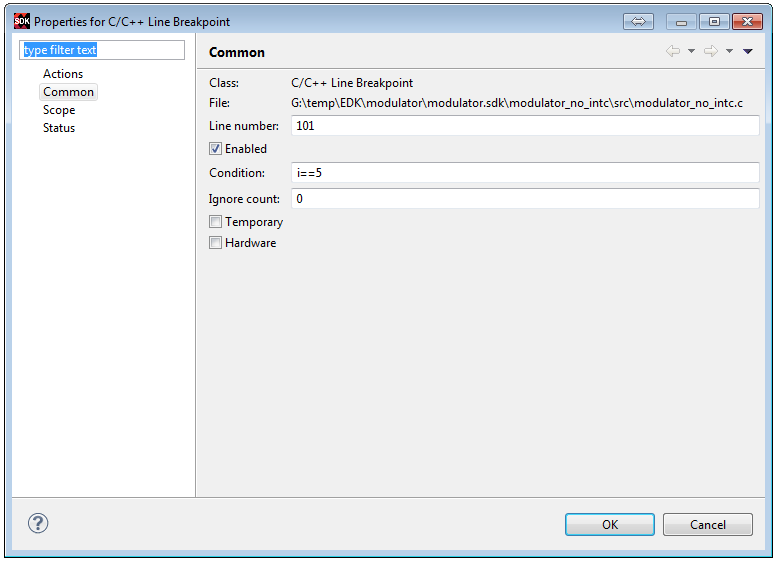
Illustration 3.44: Properties for C/C++ Line Breakpoint dialog box – condition breakpoint setup i==5
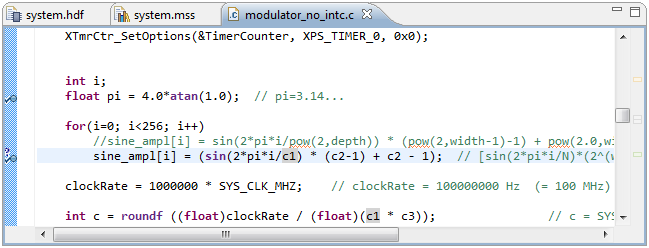
Illustration 3.45: Conditional breakpoint added
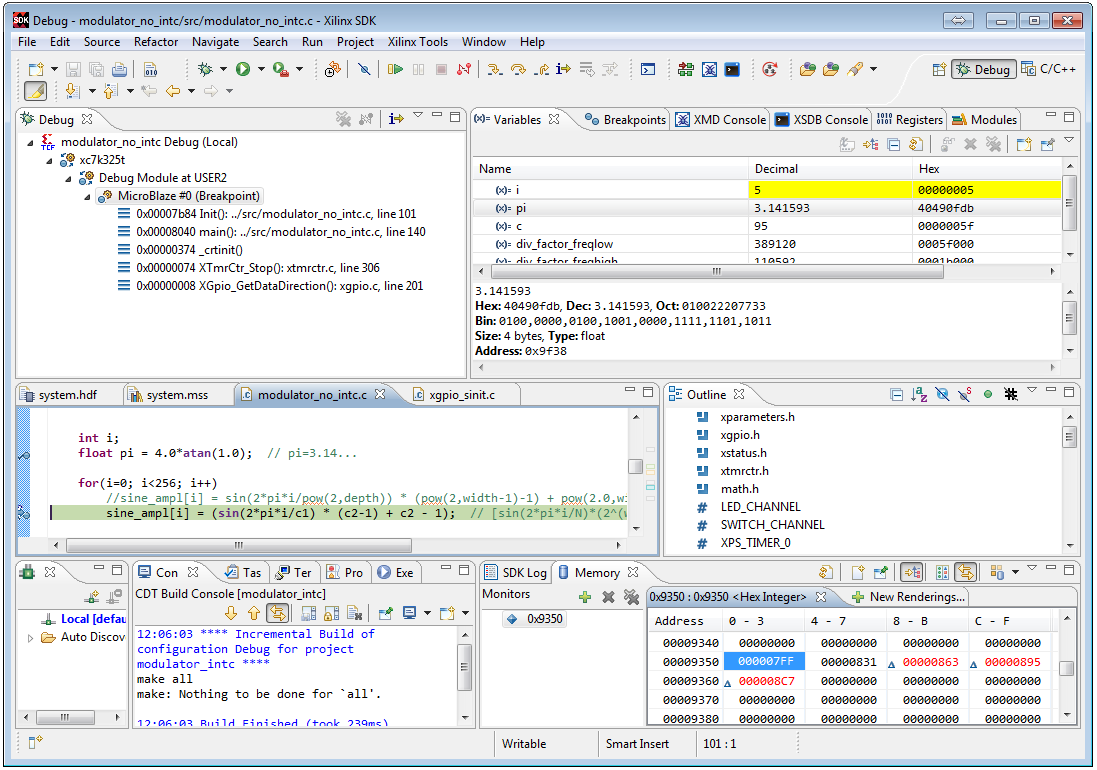
Illustration 3.46: Conditional breakpoint reached, i==5